CCSS.MATH.CONTENT.2.MD.D.10 : Second Grade Math Worksheets
About 2.MD.D.10
Draw a picture graph and a bar graph (with single-unit scale) to represent a data set with up to four categories. Solve simple put-together, take-apart, and compare problems1 using information presented in a bar graph.
Here is a collection of our common core aligned worksheets for core standard 2.MD.D.10.
A brief description of the worksheets is on each of the worksheet widgets. Click on the images to view, download, or print them. All worksheets are free for individual and non-commercial use.
Please visit 2.MD.D to view our large collection of printable worksheets. View the full list of topics for this grade and subject categorized by common core standards or in a traditional way.
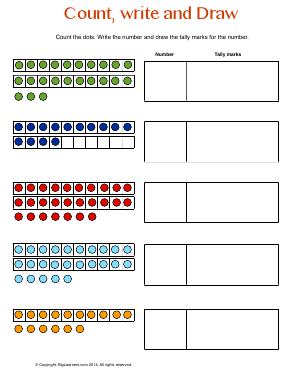
Count the dots. Write the number and draw the tally marks for the number.
Core Standard: 2.MD.D.10

Read the story, then complete the tally chart to show the correct information.
Core Standard: 2.MD.D.10


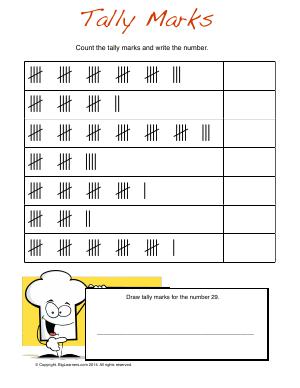
Count and write the correct number of tally marks .
Core Standard: 2.MD.D.10

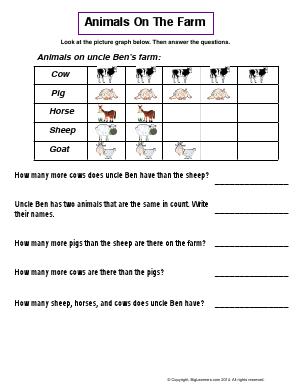
Read the picture graph representing the number of animals on Uncle Ben's farm. Answer each related question.
Core Standard: 2.MD.D.10

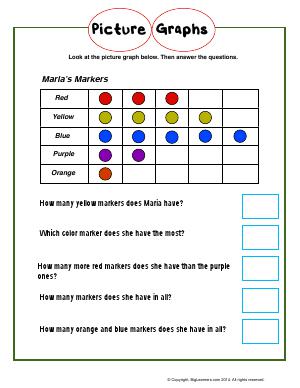
Read the graph representing children's favorite ice - cream flavor. Answer each question.
Core Standard: 2.MD.D.10


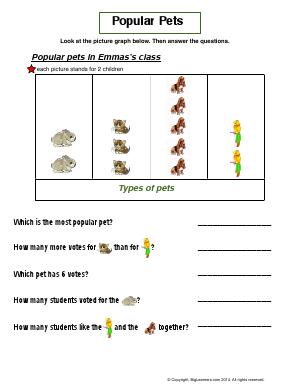
Emma's class voted for their favorite pets. Read the graph to answer each question.
Core Standard: 2.MD.D.10

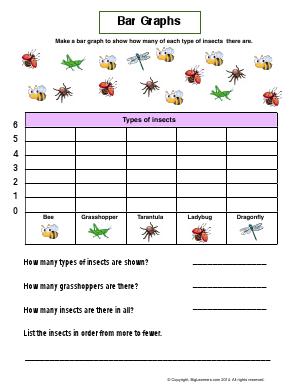
Color in the boxes on a table to make a bar graph representing the correct number of each type of insect. Then answer each related question.
Core Standard: 2.MD.D.10

Use the data from a graph to answer the questions.
Core Standard: 2.MD.D.10


Read the bar graph and answer the related questions.
Core Standard: 2.MD.D.10


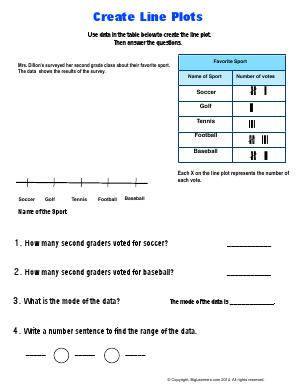
Use data from the table below to create the line plot. Then answer the questions.
Core Standard: 2.MD.D.10

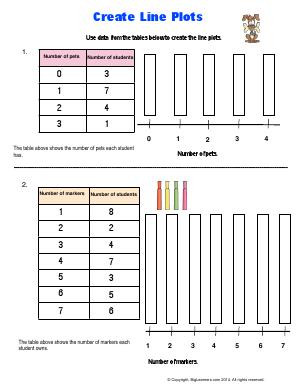
Create line plots using data from the tables.
Core Standard: 2.MD.D.10

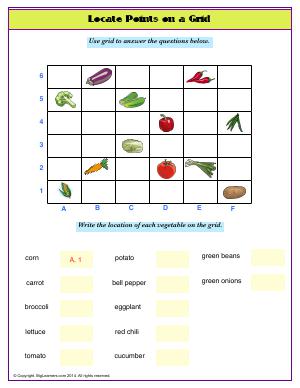
Use grid to answer the location of each vegetable.
Core Standard: 2.MD.D.10

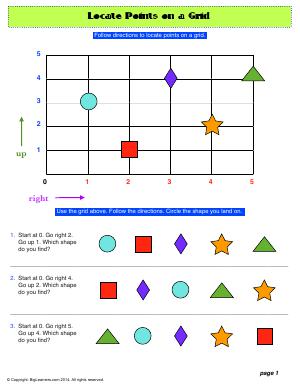
Follow directions to locate points on a grid.
Core Standard: 2.MD.D.10
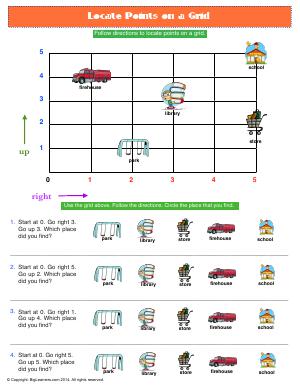

Follow directions to locate points on a grid.
Core Standard: 2.MD.D.10