CCSS.MATH.CONTENT.4.MD.B.4 : Fourth Grade Math Worksheets
About 4.MD.B.4
Make a line plot to display a data set of measurements in fractions of a unit (1/2, 1/4, 1/8). Solve problems involving addition and subtraction of fractions by using information presented in line plots. For example, from a line plot find and interpret the difference in length between the longest and shortest specimens in an insect collection.
Here is a collection of our common core aligned worksheets for core standard 4.MD.B.4.
A brief description of the worksheets is on each of the worksheet widgets. Click on the images to view, download, or print them. All worksheets are free for individual and non-commercial use.
Please visit 4.MD.B to view our large collection of printable worksheets. View the full list of topics for this grade and subject categorized by common core standards or in a traditional way.
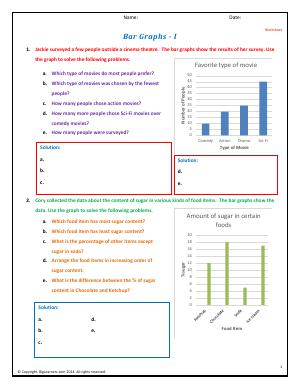
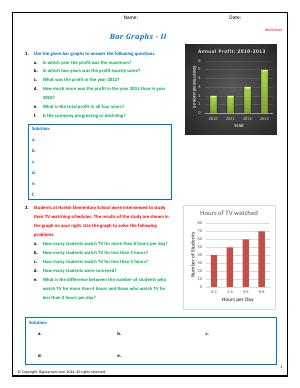
Interpret given bar graphs and solve the word problems about the graph. Identify various data points i.e minimum, maximum, most, least, sample size etc.
Core Standard: 4.MD.B.4

Learn to select the correct graph that shows trends over time or distribution of data across groups. More about circle, line and bar graphs.
Core Standard: 4.MD.B.4

Choose the correct graph to represent the data set given in the problems. Examine various graphs to find out what fits best.
Core Standard: 4.MD.B.4

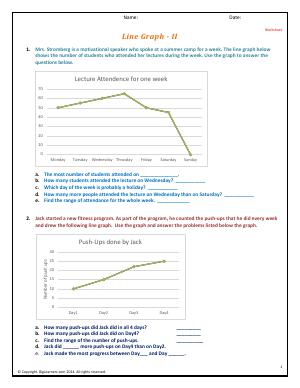
Work with two line graphs in this worksheet and compare/contrast and infer from the data presented to solve a set of problems.
Core Standard: 4.MD.B.4

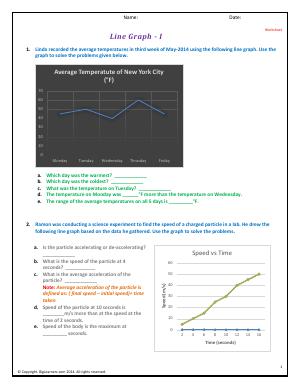
Generally, line graphs are used when data needs to shown over a time line. They are useful in detecting trends in data. Practice with line graph in this worksheet.
Core Standard: 4.MD.B.4

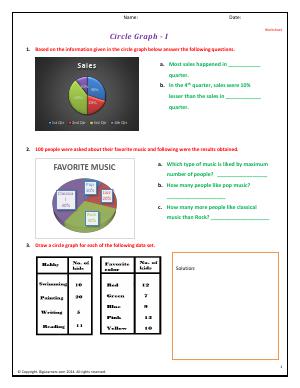
use the circle graphs to interpret information and then, solve the problems. Using the data i a table, learn to draw and annotate a circle graph.
Core Standard: 4.MD.B.4

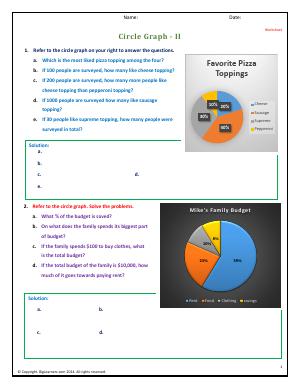
Practice worksheet to help you know and interpret data using circle graphs. Solve problems using the graph that shows a family's budget and find where the money goes.
Core Standard: 4.MD.B.4

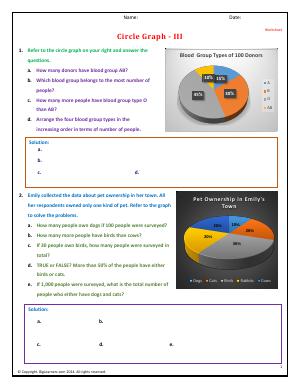
Analyze more circle graphs and solve word problems about a blood bank that shows its donor percentages using a circle graph.
Core Standard: 4.MD.B.4

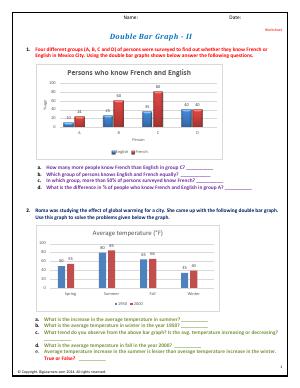
Learn about the type of information that is usually presented in double-bar graphs. Refer to the graphs in the worksheet to solve problems about the data in it.
Core Standard: 4.MD.B.4
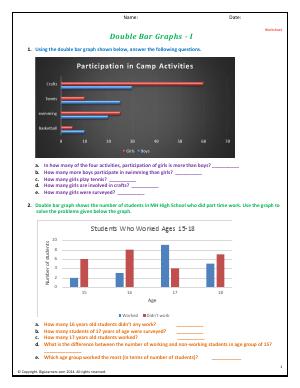

Use the double bar graphs in the worksheet to answer the problems. See how data compares between two distinct groups plotted in the double bar graph.
Core Standard: 4.MD.B.4

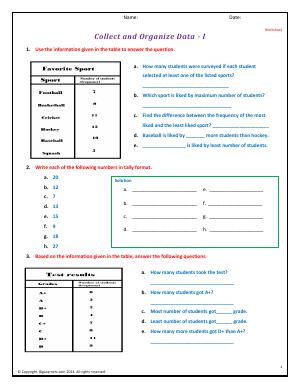
Collect and use data to make inferences about various notable points in the data i.e how many were surveyed? Which sport was the favorite of most number of students?
Core Standard: 4.MD.B.4

Look at a bar graphs that shows the annual profit of a company and then solve the word problems that requires you to compare and contrast the information presented.
Core Standard: 4.MD.B.4

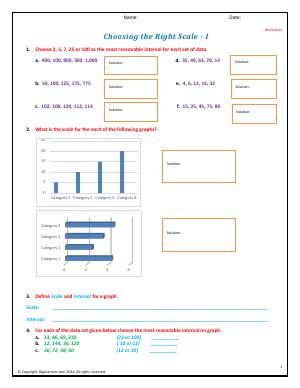
You are provided with a data set and now you have find out the appropriate interval and range so that you can present the data in the form of a chart or graph.
Core Standard: 4.MD.B.4


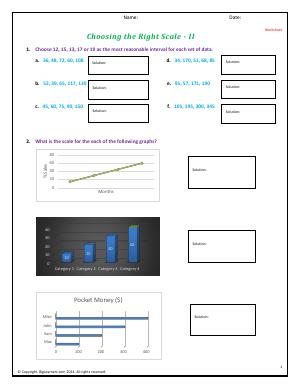
Identify a reasonable interval for a data set so that an appropriate graph can be drawn. Interpret a graph and find the range and the interval of the plotted data.
Core Standard: 4.MD.B.4


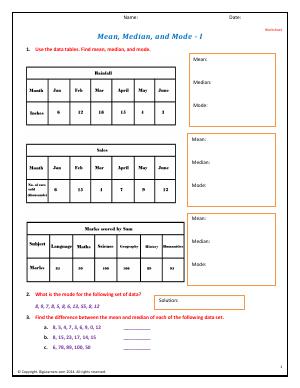
Use the data in a table or a set. Find the mean, median, or mode of the presented data. Study about mean, median, and mode before you attempt this worksheet.
Core Standard: 4.MD.B.4

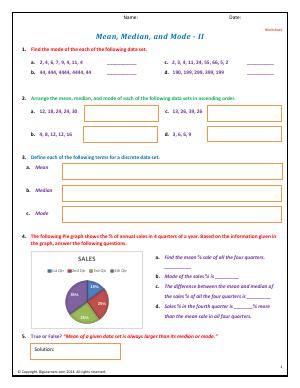
Define the terms mean, median, and mode. Find mean, median, and mode using a data set. Interpret a pie graph and solve the problems by finding the mean, median, and mode.
Core Standard: 4.MD.B.4

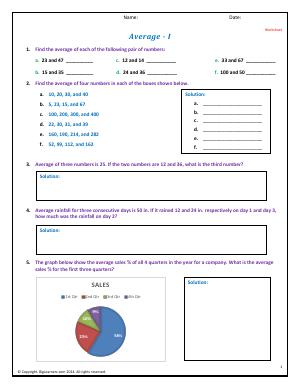
Practice finding average (mean) of 2 or more numbers. Can you find an unknown number in a data set while you are provided with average? More problems with pie charts here.
Core Standard: 4.MD.B.4

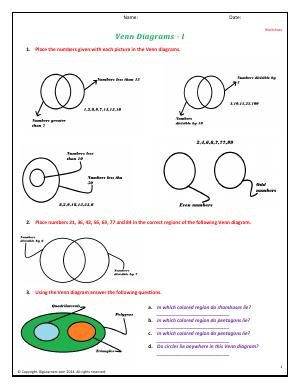
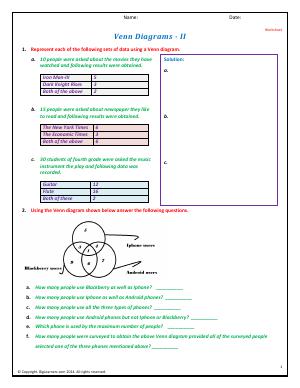
Use data from the survey that presented in the form of a table to draw a Venn diagram. Read a Venn diagram and answer the questions that are based on it in this worksheet.
Core Standard: 4.MD.B.4

Learn to identify properties of numbers or objects and then based on the distinct and common properties, place them in the Venn diagram.
Core Standard: 4.MD.B.4