Data: Interpret and Graph : Data, Graphs, and Probability : Fourth Grade Math Worksheets
Below, you will find a wide range of our printable worksheets in chapter Data: Interpret and Graph of section Data, Graphs, and Probability. These worksheets are appropriate for Fourth Grade Math. We have crafted many worksheets covering various aspects of this topic, bar and double bar graphs, circle and line graphs, choosing the appropriate graph, and many more. We hope you find them very useful and interesting.
A brief description of the worksheets is on each of the worksheet widgets. Click on the images to view, download, or print them. All worksheets are free for individual and non-commercial use.
Please visit Data, Graphs, and Probability to browse more worksheets in the same area. View the full list of topics for this grade and subject categorized by common core standards or in a traditional way.
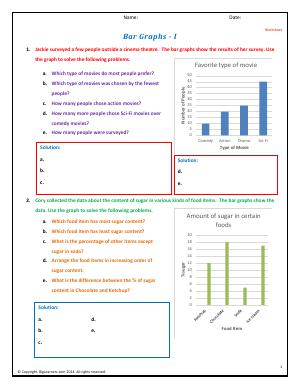
Interpret given bar graphs and solve the word problems about the graph. Identify various data points i.e minimum, maximum, most, least, sample size etc.
Category: Data, Graphs, and Probability Data: Interpret and Graph Bar and Double Bar Graphs

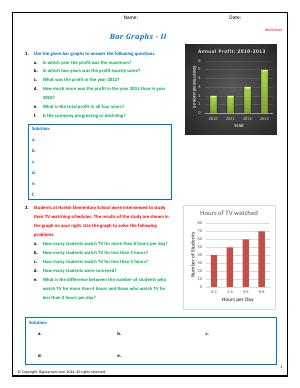
Look at a bar graphs that shows the annual profit of a company and then solve the word problems that requires you to compare and contrast the information presented.
Category: Data, Graphs, and Probability Data: Interpret and Graph Bar and Double Bar Graphs

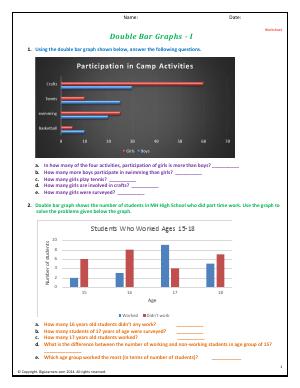
Learn about the type of information that is usually presented in double-bar graphs. Refer to the graphs in the worksheet to solve problems about the data in it.
Category: Data, Graphs, and Probability Data: Interpret and Graph Bar and Double Bar Graphs

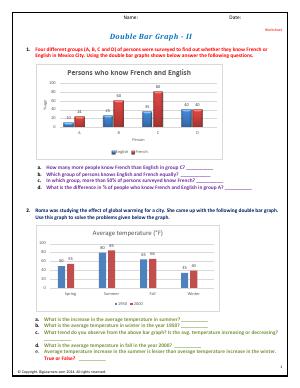
Use the double bar graphs in the worksheet to answer the problems. See how data compares between two distinct groups plotted in the double bar graph.
Category: Data, Graphs, and Probability Data: Interpret and Graph Bar and Double Bar Graphs

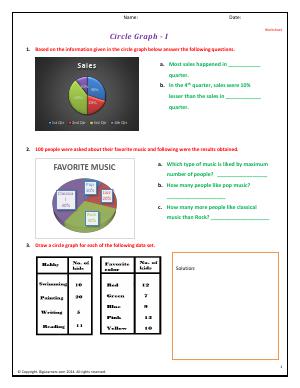
use the circle graphs to interpret information and then, solve the problems. Using the data i a table, learn to draw and annotate a circle graph.
Category: Data, Graphs, and Probability Data: Interpret and Graph Circle and Line Graphs

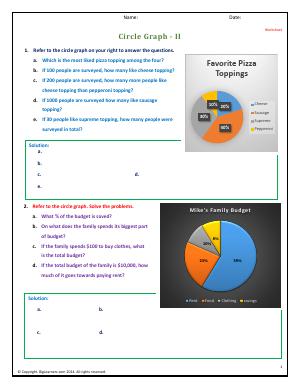
Practice worksheet to help you know and interpret data using circle graphs. Solve problems using the graph that shows a family's budget and find where the money goes.
Category: Data, Graphs, and Probability Data: Interpret and Graph Circle and Line Graphs

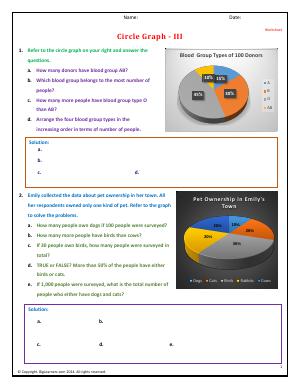
Analyze more circle graphs and solve word problems about a blood bank that shows its donor percentages using a circle graph.
Category: Data, Graphs, and Probability Data: Interpret and Graph Circle and Line Graphs

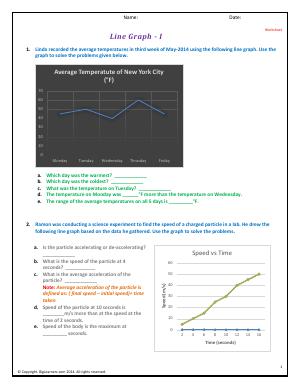
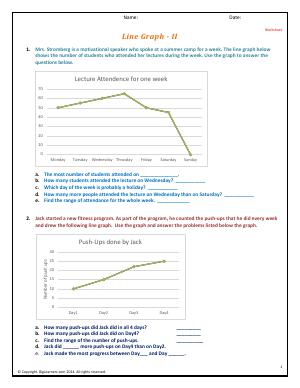
Generally, line graphs are used when data needs to shown over a time line. They are useful in detecting trends in data. Practice with line graph in this worksheet.
Category: Data, Graphs, and Probability Data: Interpret and Graph Circle and Line Graphs

Work with two line graphs in this worksheet and compare/contrast and infer from the data presented to solve a set of problems.
Category: Data, Graphs, and Probability Data: Interpret and Graph Circle and Line Graphs

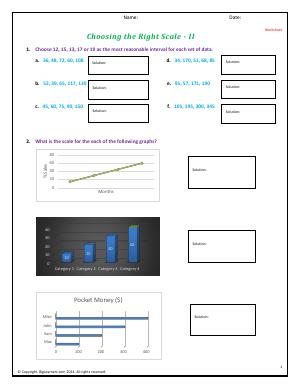
Learn to select the correct graph that shows trends over time or distribution of data across groups. More about circle, line and bar graphs.
Category: Data, Graphs, and Probability Data: Interpret and Graph Choosing the Appropriate Graph
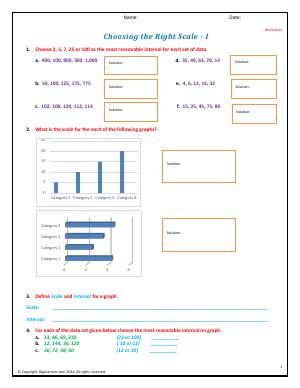

Choose the correct graph to represent the data set given in the problems. Examine various graphs to find out what fits best.
Category: Data, Graphs, and Probability Data: Interpret and Graph Choosing the Appropriate Graph

Again, please feel free to visit Data, Graphs, and Probability to browse similar worksheets that may interest you.