Data and Graphs : Fifth Grade Math Worksheets
This page contains all our printable worksheets in section Data and Graphs of Fifth Grade Math. As you scroll down, you will see many worksheets for data analysis, data display and interpretation, and more.
A brief description of the worksheets is on each of the worksheet widgets. Click on the images to view, download, or print them. All worksheets are free for individual and non-commercial use.
View the full list of topics for this grade and subject categorized by common core standards or in a traditional way.
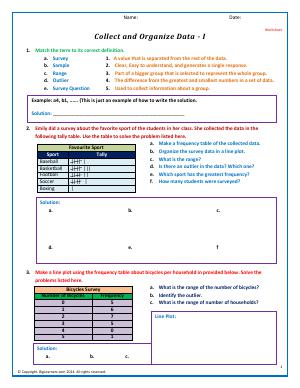
Learn about various terms used in data collection like survey, sample, range etc. Make frequency tables. identify range and sample sizes in the data collected.
Category: Data and Graphs Data Analysis Collect and Organize Data

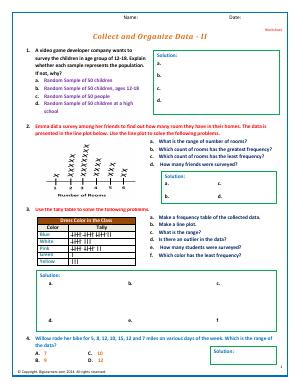
Practice selecting the right sample for survey to collect data. Interpret data from line plots and tally tables to identify range, sample size and outlier.
Category: Data and Graphs Data Analysis Collect and Organize Data

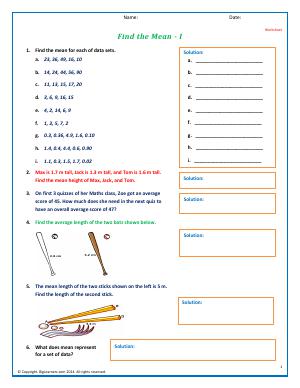
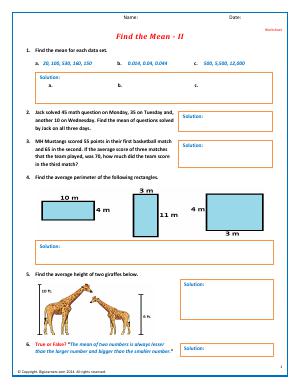
Problems in this worksheet will require finding the mean in a data set. Five averages to solve the word problems given in the sheet.
Category: Data and Graphs Data Analysis Mean, Mode and Median

Find the Mean or average from given data sets in worksheet. Simple problems require data comprehension and analysis from word problems.
Category: Data and Graphs Data Analysis Mean, Mode and Median

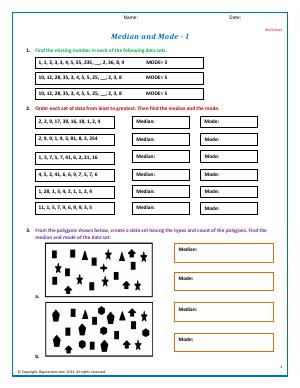
Find the median and mode from a data set and identify the missing number in the data set if the median or mode is provided. Use some image data sets for practice.
Category: Data and Graphs Data Analysis Mean, Mode and Median

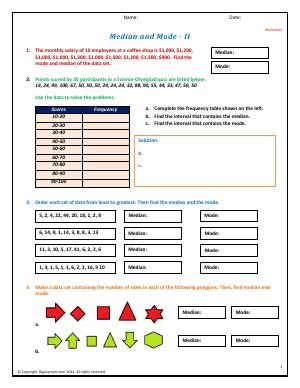
Using a set of data points, find median and mode. Make frequency tables, identify intervals, and use your analysis to find mode and median.
Category: Data and Graphs Data Analysis Mean, Mode and Median

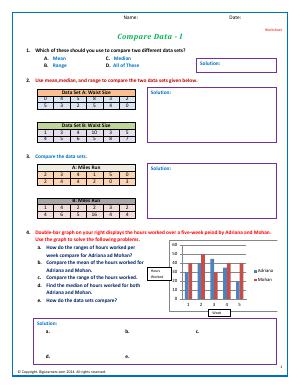
use mean, mode, median and range to compare a pair of data sets in this worksheet. Work with a double bar graph to compare various data points in this worksheet.
Category: Data and Graphs Data Analysis Compare Data

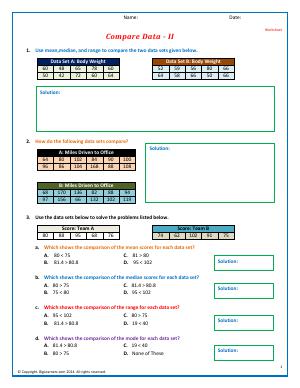
Expand your data comparison skills using the data sets in this worksheet. Solve multiple choice questions for test preparations involving two sets of data.
Category: Data and Graphs Data Analysis Compare Data

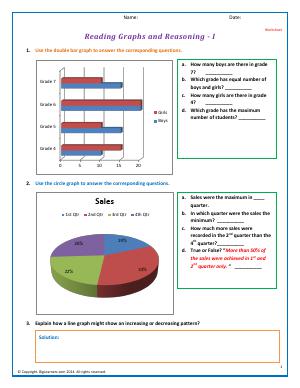
Reading data from double bar graphs and pie charts to solve problems based on interpretation of the data. Explain the use cases for line graphs.
Category: Data and Graphs Data Analysis Reading Graphs and Reasoning

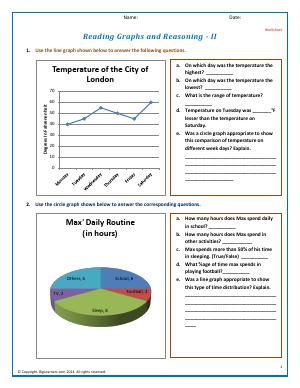
Read a line graph showing the average day temperatures of London in a week and solve the given problems. Get acquainted to circle graph in this worksheet.
Category: Data and Graphs Data Analysis Reading Graphs and Reasoning

Practice problems to help you make stem and leaf plots from a wide range of data set in this worksheet.
Category: Data and Graphs Data Display and Interpretation Histograms and Stem-and-Leaf Plots
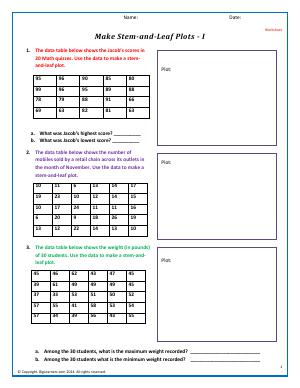

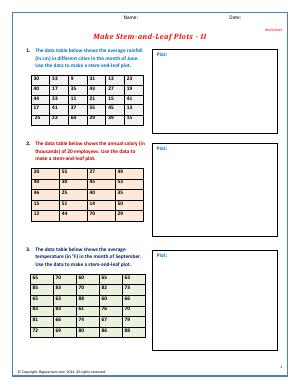
Three problems are there in this worksheet to make you fluent in making stem and leaf plots using a big data set.
Category: Data and Graphs Data Display and Interpretation Histograms and Stem-and-Leaf Plots

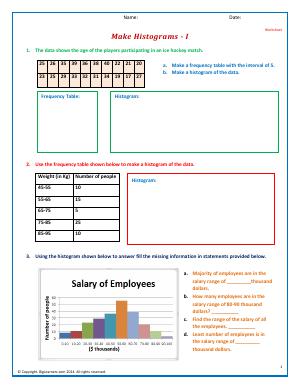
Make a frequency table from a given data set and then use it make a histogram. Interpret a histogram and identify range in various intervals in the chart.
Category: Data and Graphs Data Display and Interpretation Histograms and Stem-and-Leaf Plots

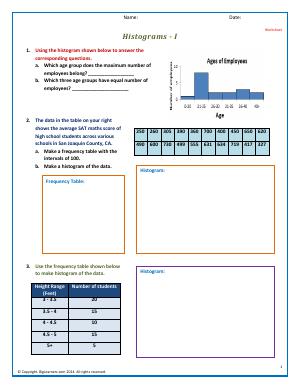
Correlate data sets, frequency tables, and histograms. Solve problems that require to find you the range of subsets of this data in this worksheet.
Category: Data and Graphs Data Display and Interpretation Histograms and Stem-and-Leaf Plots

Practice working with scale and interval using the given data sets and then draw line graphs to see the trends in the data.
Category: Data and Graphs Data Display and Interpretation Line Graphs
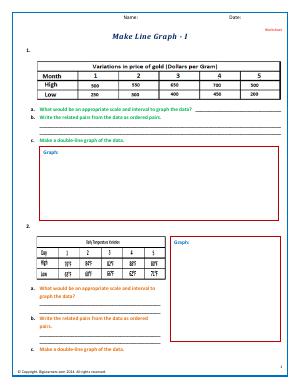

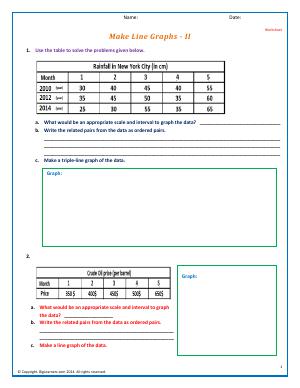
Practice making a line graph using the almanac of New York city. Identify appropriate scale and interval to draw a line graph. Another problem requires you to work with oil prices.
Category: Data and Graphs Data Display and Interpretation Line Graphs

A data set can be graphed in various different kind of charts. This worksheet is to help you judge which graph is the most suitable for a certain kind of data and situation.
Category: Data and Graphs Data Display and Interpretation Selecting a Graph for Data
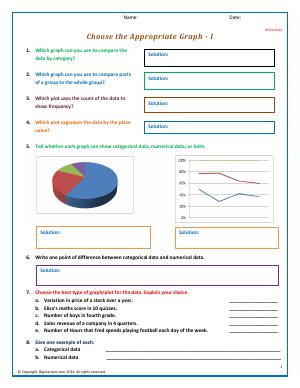

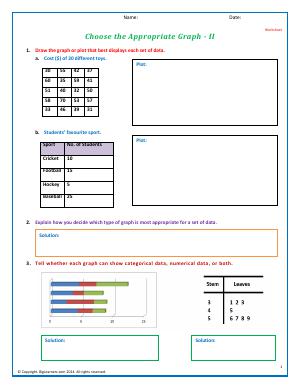
Choose the best graph according to the data provided. Identify what is more suitable to represent numerical and categorical data.
Category: Data and Graphs Data Display and Interpretation Selecting a Graph for Data

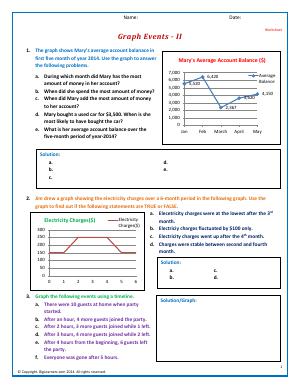
Graphing events is a skill which requires plotting data on a time line. This is useful in situation when trends need to be identified on a specific timeline.
Category: Data and Graphs Data Display and Interpretation Graphing Events
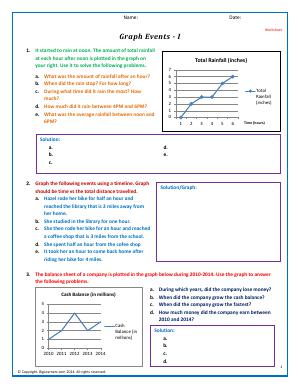

Look at the line plot drawn on a time scale. Solve the problems based on the plot and enhance your skills to read graphs based on events and time.
Category: Data and Graphs Data Display and Interpretation Graphing Events