Data Display and Interpretation : Data and Graphs : Fifth Grade Math Worksheets
Below, you will find a wide range of our printable worksheets in chapter Data Display and Interpretation of section Data and Graphs. These worksheets are appropriate for Fifth Grade Math. We have crafted many worksheets covering various aspects of this topic, histograms and stem-and-leaf plots, line graphs, selecting a graph for data, graphing events, and many more. We hope you find them very useful and interesting.
A brief description of the worksheets is on each of the worksheet widgets. Click on the images to view, download, or print them. All worksheets are free for individual and non-commercial use.
Please visit Data and Graphs to browse more worksheets in the same area. View the full list of topics for this grade and subject categorized by common core standards or in a traditional way.
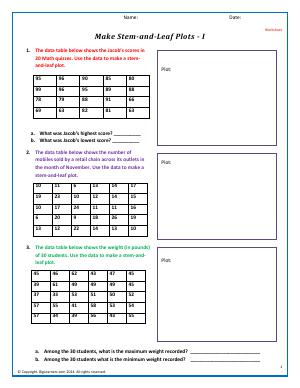
Practice problems to help you make stem and leaf plots from a wide range of data set in this worksheet.
Category: Data and Graphs Data Display and Interpretation Histograms and Stem-and-Leaf Plots

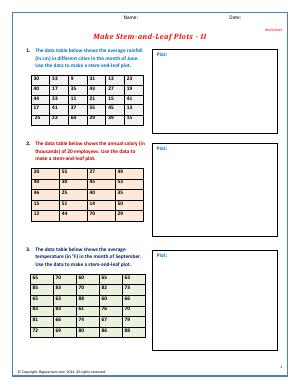
Three problems are there in this worksheet to make you fluent in making stem and leaf plots using a big data set.
Category: Data and Graphs Data Display and Interpretation Histograms and Stem-and-Leaf Plots

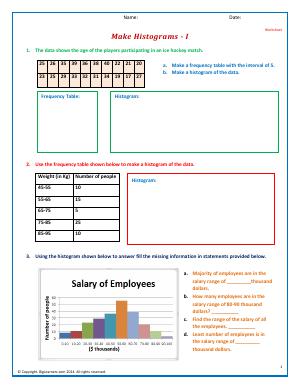
Make a frequency table from a given data set and then use it make a histogram. Interpret a histogram and identify range in various intervals in the chart.
Category: Data and Graphs Data Display and Interpretation Histograms and Stem-and-Leaf Plots

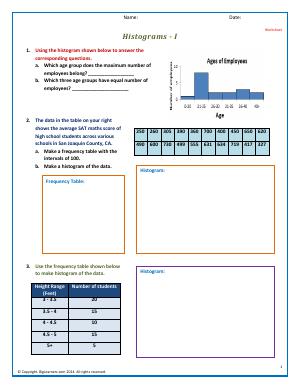
Correlate data sets, frequency tables, and histograms. Solve problems that require to find you the range of subsets of this data in this worksheet.
Category: Data and Graphs Data Display and Interpretation Histograms and Stem-and-Leaf Plots

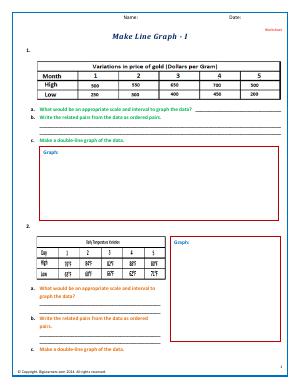
Practice working with scale and interval using the given data sets and then draw line graphs to see the trends in the data.
Category: Data and Graphs Data Display and Interpretation Line Graphs

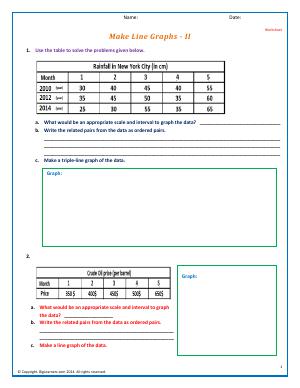
Practice making a line graph using the almanac of New York city. Identify appropriate scale and interval to draw a line graph. Another problem requires you to work with oil prices.
Category: Data and Graphs Data Display and Interpretation Line Graphs

A data set can be graphed in various different kind of charts. This worksheet is to help you judge which graph is the most suitable for a certain kind of data and situation.
Category: Data and Graphs Data Display and Interpretation Selecting a Graph for Data
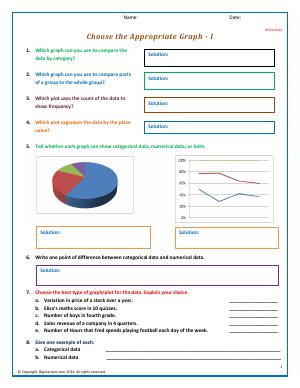

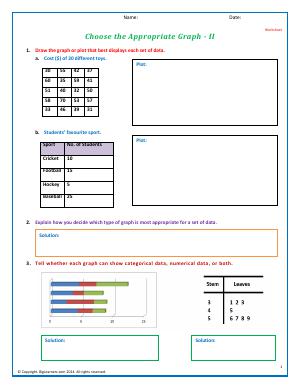
Choose the best graph according to the data provided. Identify what is more suitable to represent numerical and categorical data.
Category: Data and Graphs Data Display and Interpretation Selecting a Graph for Data

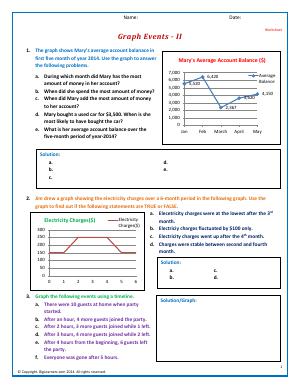
Graphing events is a skill which requires plotting data on a time line. This is useful in situation when trends need to be identified on a specific timeline.
Category: Data and Graphs Data Display and Interpretation Graphing Events
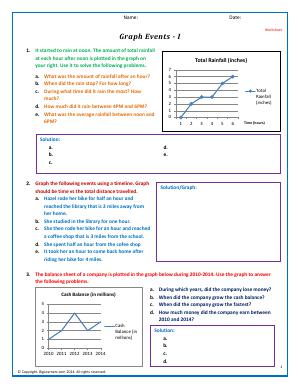

Look at the line plot drawn on a time scale. Solve the problems based on the plot and enhance your skills to read graphs based on events and time.
Category: Data and Graphs Data Display and Interpretation Graphing Events

Again, please feel free to visit Data and Graphs to browse similar worksheets that may interest you.