Graphing Events : Data and Graphs : Fifth Grade Math Worksheets
Here is a collection of our printable worksheets for topic Graphing Events of chapter Data Display and Interpretation in section Data and Graphs.
A brief description of the worksheets is on each of the worksheet widgets. Click on the images to view, download, or print them. All worksheets are free for individual and non-commercial use.
Please visit Data Display and Interpretation or Data and Graphs to view our large collection of printable worksheets. View the full list of topics for this grade and subject categorized by common core standards or in a traditional way.
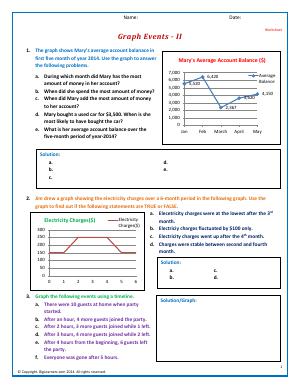
Graphing events is a skill which requires plotting data on a time line. This is useful in situation when trends need to be identified on a specific timeline.
Category: Data and Graphs Data Display and Interpretation Graphing Events
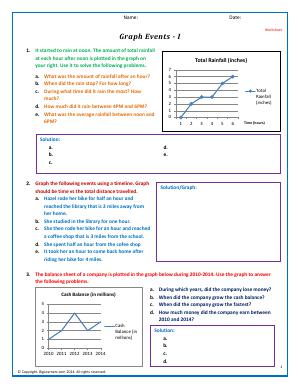

Look at the line plot drawn on a time scale. Solve the problems based on the plot and enhance your skills to read graphs based on events and time.
Category: Data and Graphs Data Display and Interpretation Graphing Events

Again, we encourage you to see more printable worksheets in Data Display and Interpretation or Data and Graphs.