Line Graphs : Data and Graphs : Fifth Grade Math Worksheets
Here is a collection of our printable worksheets for topic Line Graphs of chapter Data Display and Interpretation in section Data and Graphs.
A brief description of the worksheets is on each of the worksheet widgets. Click on the images to view, download, or print them. All worksheets are free for individual and non-commercial use.
Please visit Data Display and Interpretation or Data and Graphs to view our large collection of printable worksheets. View the full list of topics for this grade and subject categorized by common core standards or in a traditional way.
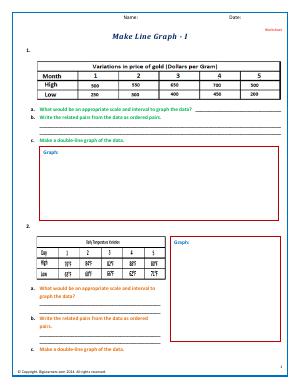
Practice working with scale and interval using the given data sets and then draw line graphs to see the trends in the data.
Category: Data and Graphs Data Display and Interpretation Line Graphs

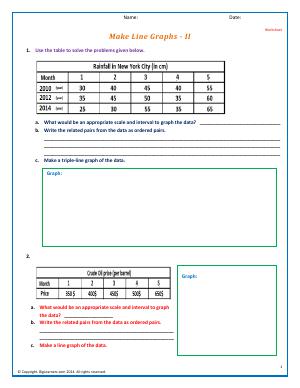
Practice making a line graph using the almanac of New York city. Identify appropriate scale and interval to draw a line graph. Another problem requires you to work with oil prices.
Category: Data and Graphs Data Display and Interpretation Line Graphs

Again, we encourage you to see more printable worksheets in Data Display and Interpretation or Data and Graphs.